The full name

email@vos.com

Search
Organoid_Visualization_main
Holotomography

Organoid Visualization

1000€+
Holotomography

Organoid Visualization

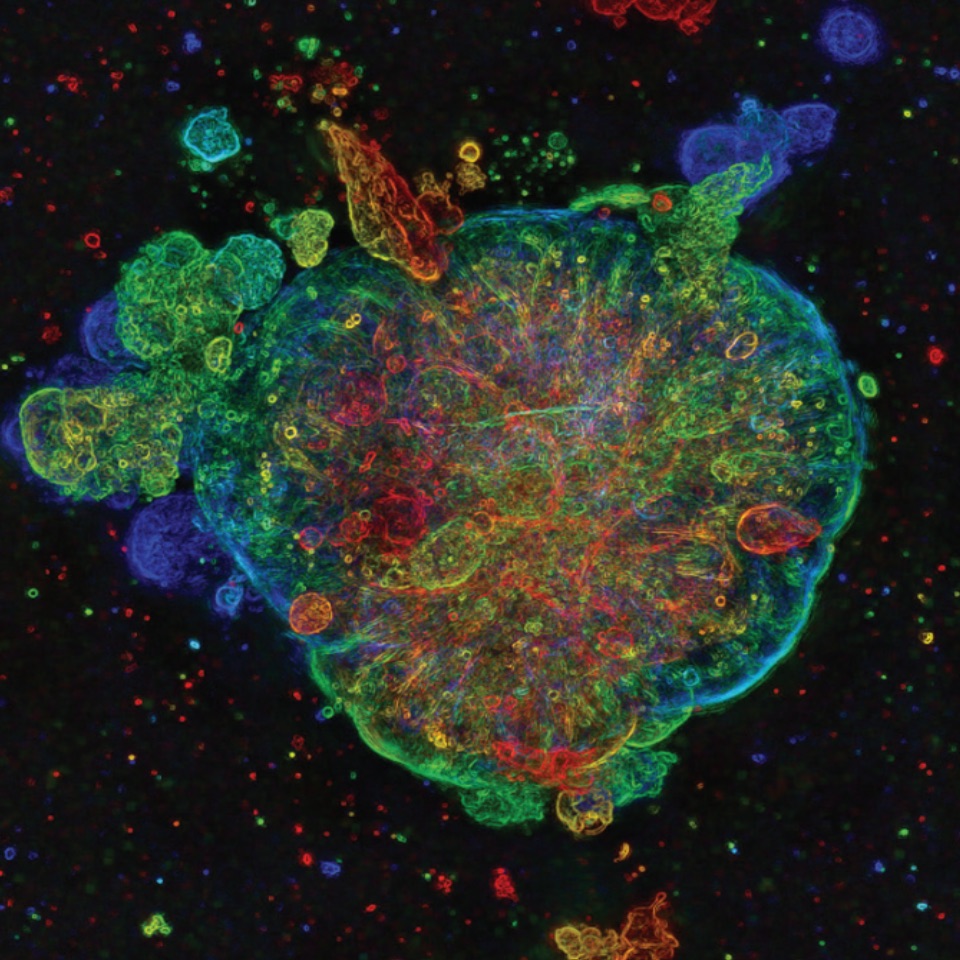
  • Visualization of Organoid Structures and Interiors without Pretreatment
    HT allows the visualization of organoids' full structures and interiors in high-resolution 3D without any pretreatment or manipulation, preserving the integrity of the sample.
  • Visualization of Specific Cells and Biological Phenomena
    HT can visualize specific cells, such as Paneth cells, and dynamic biological phenomena within organoids in high-resolution 3D.
  • Accurate and Quantitative Analysis
    The TomoAnalysis software transforms complex organoid analysis into precise, quantitative insights.
  • Non-invasive Real-time 3D Monitoring
    HT provides non-invasive real-time 3D monitoring and analysis of organoids, allowing for the tracking of long-term changes.
  • Organoid Culture Maintained Post-Imaging
    Organoid cultures remain intact after imaging with HT, enabling further experiments, making it valuable for drug development and personalized medicine strategies.

Price
Organism
Product Type
Tissue
Disease

Applications

Holotomography

3D biology

Description

Table of Contents

Organoid Visualization and Analysis

HT offers two key applications in organoid research. First, it allows for the identification and long-term tracking of cell subtypes within small intestinal organoids without staining. Second, it visualizes and precisely quantifies the growth and development of hepatic organoids. The main advantage of HT is that organoid cultures remain intact after imaging, allowing for further experiments, making it valuable for drug development and personalized medicine strategies.

Read out

organoid_visualization_01
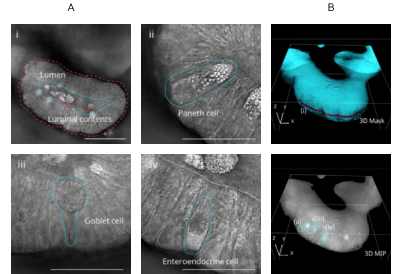
Holotomography imaging of small intestinal organoids and the  characteristics of cell subtypes.

(A) Morphological features of small intestinal organoid.
(i) Lumen of organoid and the secreted contents.
(ii) Paneth cell, (iii) Enteroendocrine cell and (iv) Goblet cell. Scale bar: 20 μm.
(B) 3D visualization of organoid and masked cells, with TomoAnalysis.
The magenta line represents the XY slice presented in (i).
The blue area represents the masked region (above).
Each cells from Figure 2A are labeled as (ii) – (iv) (below).
MIP: Maximum Intensity Projection.

organoid_visualization_02
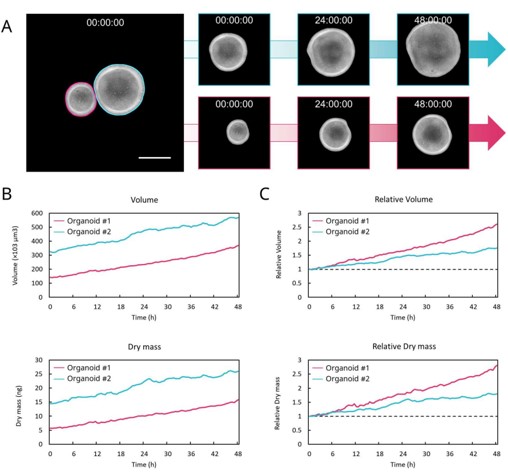
Quantification results of organoid’s growth.

(A) Representative images of processed ROI for each organoid. Scale bar: 50 μm
(B) The development of the tracked organoids monitored by the volume and the dry mass.
(C) Relative changes of the volume and the dry mass with respect to the time point, t = 0. The dotted line represents the initial value at the timepoint, t = 0.

Connect with Us

By submitting your details, you confirm that you have reviewed and agree with the Lambda Biologics Privacy Policy.