The full name

email@vos.com

Search
long-term_timelapse
Holotomography

Long-Term Timelapse

1000€+
Holotomography

Long-Term Timelapse

  • Label-free Long-term Live Cell Imaging
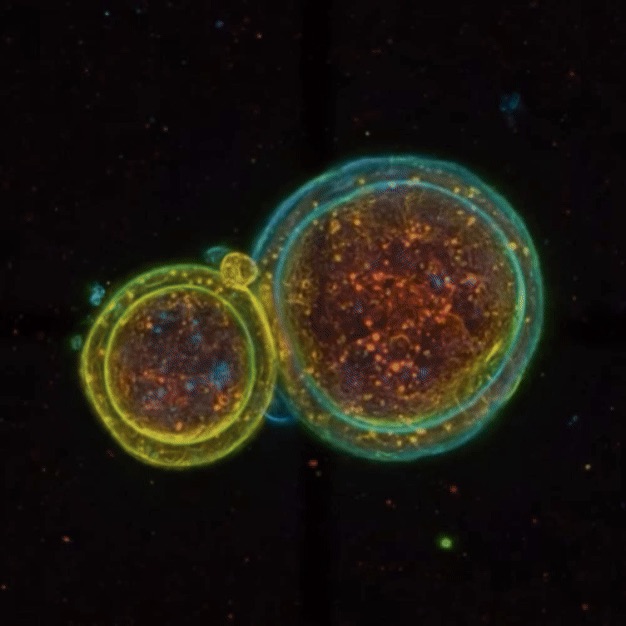
    HT technology allows for the long-term observation of LPS-treated RAW 264.7 macrophages without the need for labeling. Morphological and biochemical changes can be visualized using 3D RI tomograms and quantitatively analyzed at the single-cell level.
  • Analysis of Cell Activation Process
    After LPS treatment, RAW 264.7 macrophages increase in volume, leading to changes in surface area and sphericity. These changes result in a decrease in mean RI, protein concentration, and dry mass. The study suggests that LPS-induced changes occur early in the activation process and persist for up to 24 hours.
  • Quantitative Time-lapse Monitoring
    HT technology allows for the tracking of quantitative parameters, such as volume, protein concentration, and mean RI, in macrophages over time following LPS treatment. This is useful for precisely monitoring the activation state of cells.
  • TomoStudio Software
    The TomoStudio software is used to generate 3D RI tomograms and automatically segment cells to calculate various quantitative data, including volume, surface area, protein concentration, and dry mass.
  • Application and Expansion Potential
    HT technology is valuable not only for analyzing the activation process of macrophages but also for studying various cell types and biological phenomena.

Price
Organism
Product Type
Tissue
Disease

Applications

Holotomography

Cell biology

Description

Table of Contents

Long-term Timelapse

HT effectively assesses changes in LPS-treated RAW 264.7 macrophages. The cells were imaged without labels, revealing that LPS causes an increase in cell volume and changes in surface area, sphericity, mean RI, protein concentration, and dry mass. These changes occur early and persist for up to 24 hours. HT is valuable for quantitatively analyzing live cell activation at the single-cell level.

Read out

Significant changes in quantitative parameters after LPS treatment
Volume, surface area and dry mass is increased (A-C), while mean RI, protein concentration and sphericity is decreased (D-F) in RAW 264.7 cells. Box plots represent min to max and show all points. Significance was calculated using values of 0, 2, 4, 6, 8 hours. *p < 0.05, **p < 0.01, ***p < 0.001, ****p < 0.0001 by one-way ANOVA with Tukey’s multiple comparison test; ns, not significant. (N; 0=15, 2=16, 4=21, 6=22, 8=17, 24=26.)
Continuous alterations in quantitative parameters after LPS administration

(A) Changes in mean RI of individual RAW 264.7 cells over short (2 hours, one tomogram per 2 minutes) time-scale monitoring. Each colored line represents the time trajectory of the recorded parameter of an individual RAW 264.7 cell. (B-D) The graphs present the first and the last recorded time-points of RAW 264.7 cell’s
mean RI, protein concentration, and volume measurement, respectively. Scatter dot with bar plot represents mean with SD and show all points.
****p < 0.0001 by paired t-test. (N=28)

Connect with Us

By submitting your details, you confirm that you have reviewed and agree with the Lambda Biologics Privacy Policy.