The full name

email@vos.com

Search
lipid_quantification_main
Holotomography

Lipid Quantification

1000€+
Holotomography

Lipid Quantification

  • Label-free Lipid Quantification
    HT technology enables high-resolution 3D visualization and quantification of intracellular lipids without the need for labeling or staining, allowing accurate measurement of lipid content without disrupting the cellular environment.
  • Tracking Dynamic Changes Over Time
    HT allows for the tracking of the distribution and changes in lipid droplets over time, making it ideal for studying the dynamics of cellular lipid metabolism.
  • Detection of High Refractive Index (RI) Molecules
    HT accurately visualizes lipid droplets with high RI, distinguishing them from other cellular components without the need for fluorescence staining.
  • Ideal for In Vivo Lipid Metabolism Studies
    HT has significant potential for applications in cell biology, bioengineering, and the biofuels industry, offering rapid measurement of cellular lipid content, which is valuable for research in metabolic diseases and other fields.
  • Versatile Applications
    Beyond lipid droplets, HT can also be applied to study other high RI molecules, such as polymers, nanoparticles, and liposomes.

Price
Organism
Product Type
Tissue
Disease

Applications

Holotomography

Cell biology

LLPS

Description

Table of Contents

Lipid Quantification

Holotomography is ideal for studying lipid metabolism in living cells, allowing time-lapse observation without staining or phototoxicity. It effectively detects high refractive index molecules like lipid droplets, making it valuable in cell biology, bioengineering, and biofuels.

Read out

lipid_quantification_01
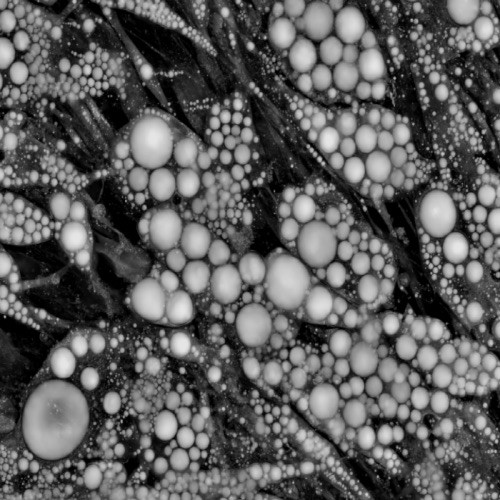
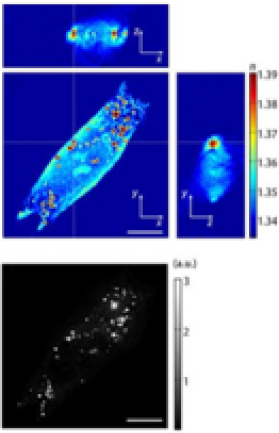
Holotomography of a human hepatocyte, Huh-7

3D tomogram images (Left) fluorescence stained with Nile Red (Right). Reproduced by from Kim et al. Scientific Reports 6:36815 (2016).

lipid_quantification_03
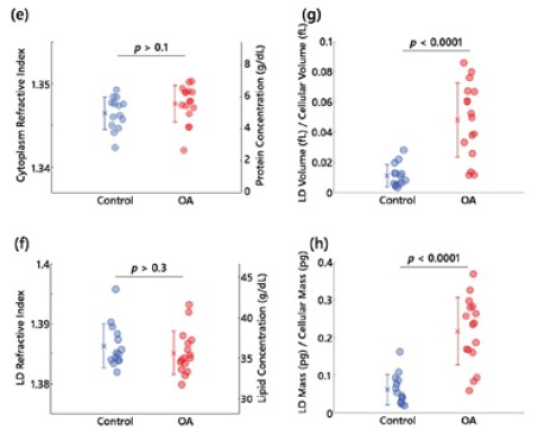
3D RI tomograms of lipid droplets in live hepatocytes

(a,b) 3D rendered isosurface image of 3D RI distribution of (a) an untreated and (b) OA treated hepatocyte.
(c,d) Cross-sectional slice images of 3D RI distribution of (a) the untreated and (b) OA treated hepatocyte.
The scale bars indicate 10μm. e-h, Quantitative analysis of (e) RI of cytoplasm, (f) RI of LDs, (g) the ratio of LD volume to cell volume, (h) the ratio of LD mass to cellular dry mass, Reproduced from Kim et al., Scientific Reports 6:36815 (2016).

Connect with Us

By submitting your details, you confirm that you have reviewed and agree with the Lambda Biologics Privacy Policy.