CODEX was developed to overcome the limitations of existing IHC. Multiplex IHC is an experimental method that can confirm the expression of more than 100 biomarkers on one tissue slide. It is possible to check the expression of various biomarkers on a single tissue slide and conduct comprehensive research on cell composition, cell function and state, and cell-cell interaction. CODEX analysis is performed using DNA barcoding and uses antibodies conjugated to unique oligonucleotide sequences. By using a target specific barcode called dye-labelled reporter, it is possible to stain more than 100 biomarkers by repeating the labeling cycle by dyeing three colors of fluorescence in one cycle.
CODEX
Staining more than 100 biomarkers on tissue slides 1 chapter.
Mapping of Millions of Cells Through Diverse Panel Combinations.
Single cell resolution analysis.
Cell phenotyping using marker staining combinations.
Cellular Neighborhood Analysis Utilizing Spatial Information of Cells.
Process
Staining
2 days
FFPE or FF tissue section
Antigen Unmaking
Tissue staining
Primary antibody incubation
Reporter plate preparation
PCF run
Image
1-3 days per slide
Continuous speed improvements
Workflow simplification
Consistent imaging methods
Analyze
4 months
Proprietary data compression
Solutions serve every user need
Consistent image analysis methods
Step 1 : Sample preparation
Step 2 : Tissue staining (primary antibody)
Step 3 : Reporter plate preparation
Step 4 : PCF run
Step 5 : Data analysis
Immune profiling panels type
Immune panel – 31 markers
STEP core panel
1
2
3
4
5
6
7
8
9
10
11
12
13
14
15
CD4
CD68
CD20
CD11c
CD8
HLA-DR
CD3e
CD44
CD45
HLA-A
CD14
Ki67
Pan-CK
CD56
CD45RO
Helper T cells
Macrophages
B cells
Dendritic cells
Cytotoxic T cells
APCs (MHC II)
T cells
Activated T cells
Immune cells
MHC I
Monocytes
Proliferating cells
Tumor cells
NK cells
Memory T cells
Advanced Immune module
1
2
3
4
CD163
FoxP3
Granzyme B
CD21
M2 Macrophages
Regulatory T cells
Activated T cells / NK cells
Dendritic cells, mature B cells, FDCs
Immune activation module
1
2
3
4
5
PD-1
LAG-3
ICOS
PD-L1
IDO1
Checkpoint receptor
Checkpoint receptor
Checkpoint receptor
Checkpoint ligand
Multifunctional/Immune inhibitory
Structural module
1
2
3
4
5
6
7
E-cadherin
SMA
Vimentin
Collagen IV
CD31
CD34
Podoplanin
Epithelial cells
Vascular, Fibroblasts, Smooth muscle
Cyto-structures
Extracellular matrix
Vascular structures
Vascular structures
Lymphatics
Readout
31markers (charged slide)
PDOX BTLA
PDOX HVEM
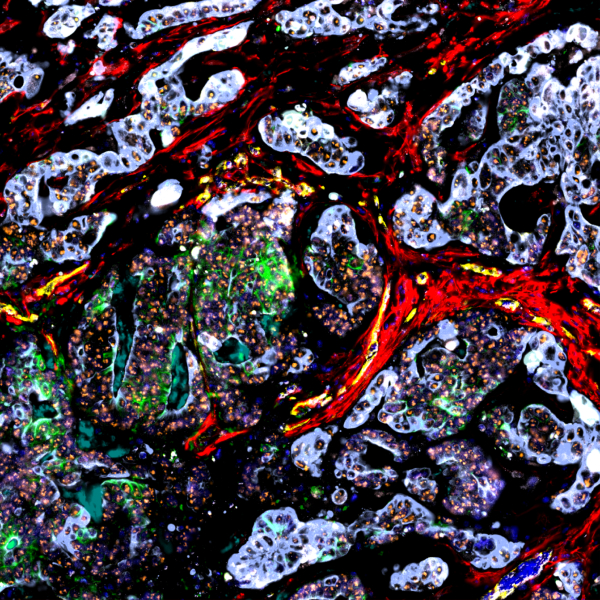
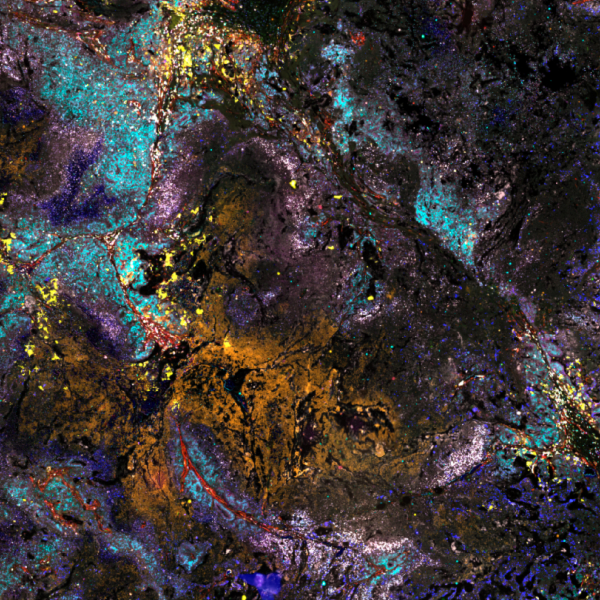
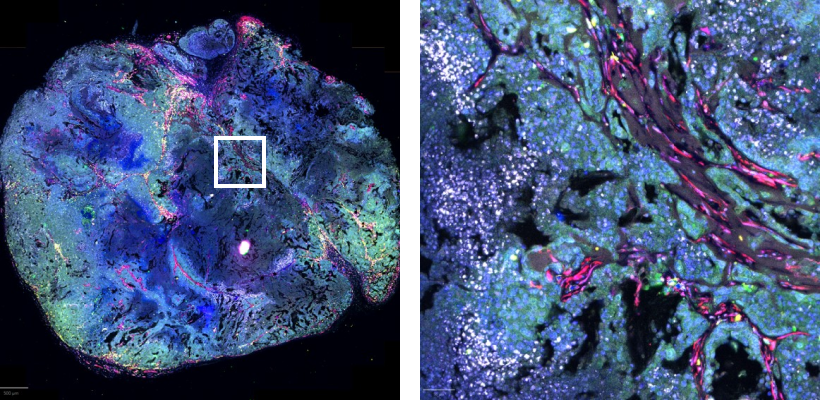
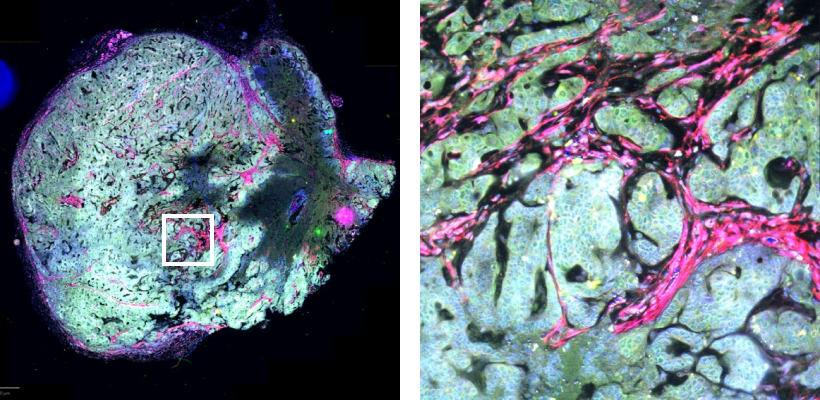
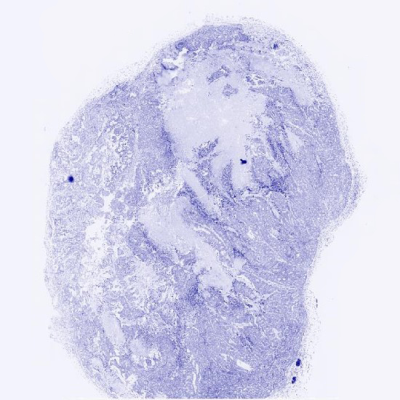
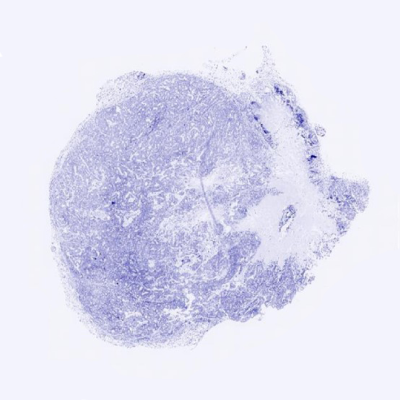
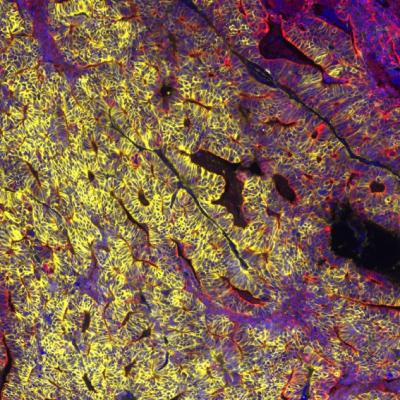
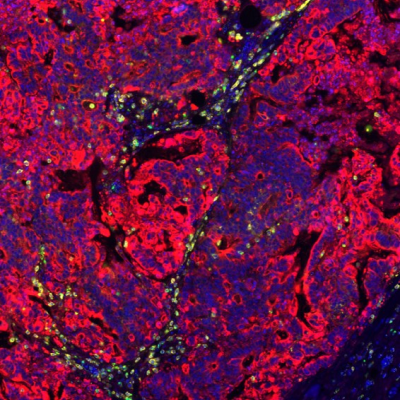
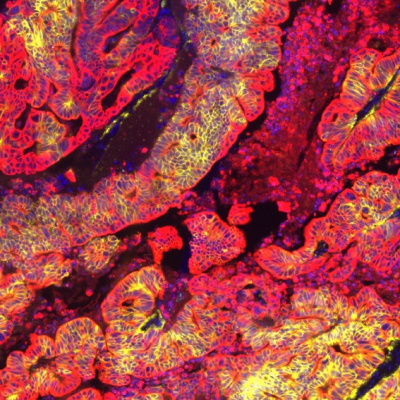
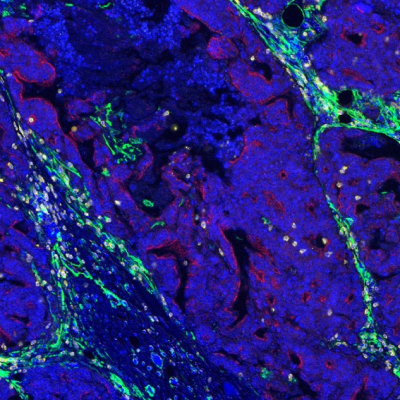
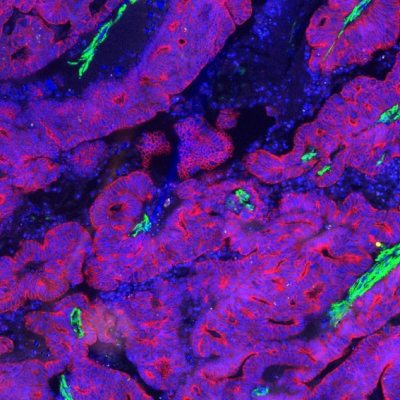
To identify the mechanism of a new target, acquire spatial information by simultaneously staining 31 markers in PDOX tissue.
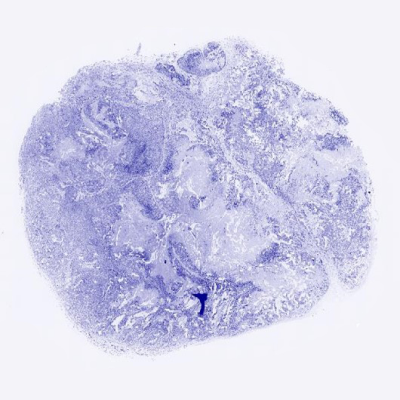
Simultaneous staining of 31 markers in tumor tissue
IgG control
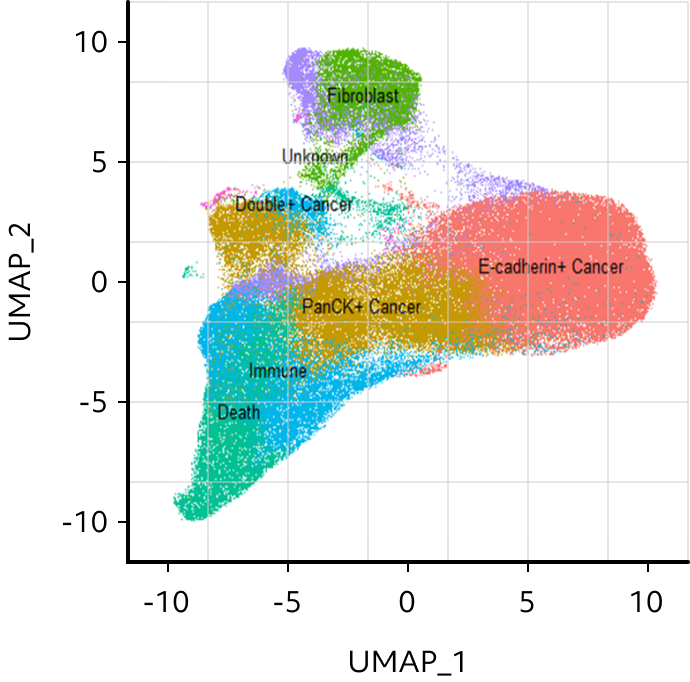
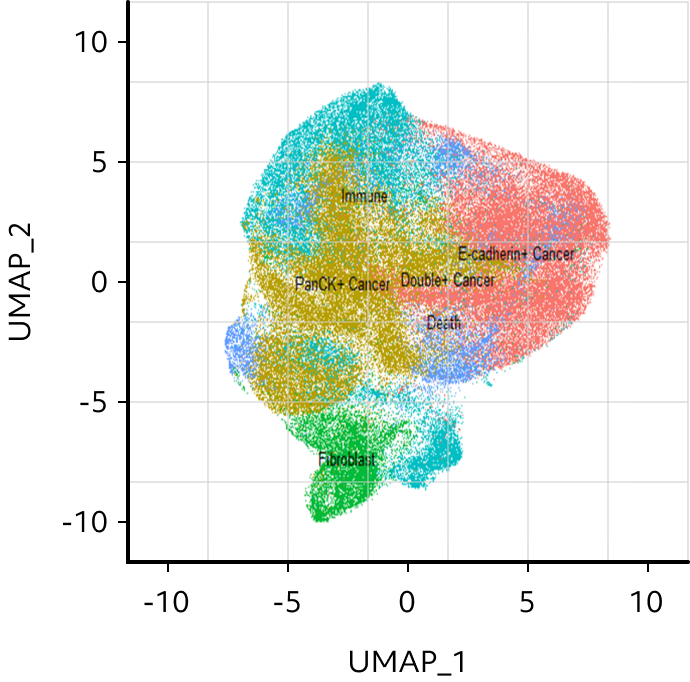
Cell types
IgG control
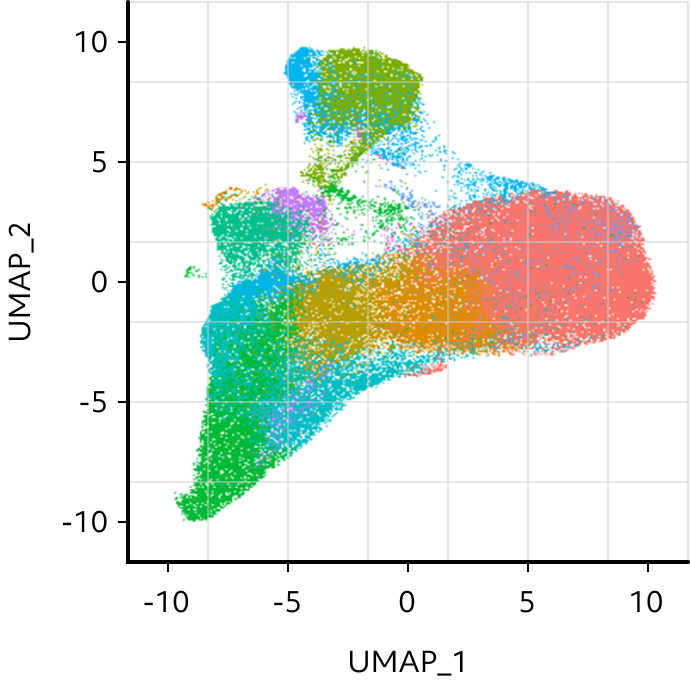
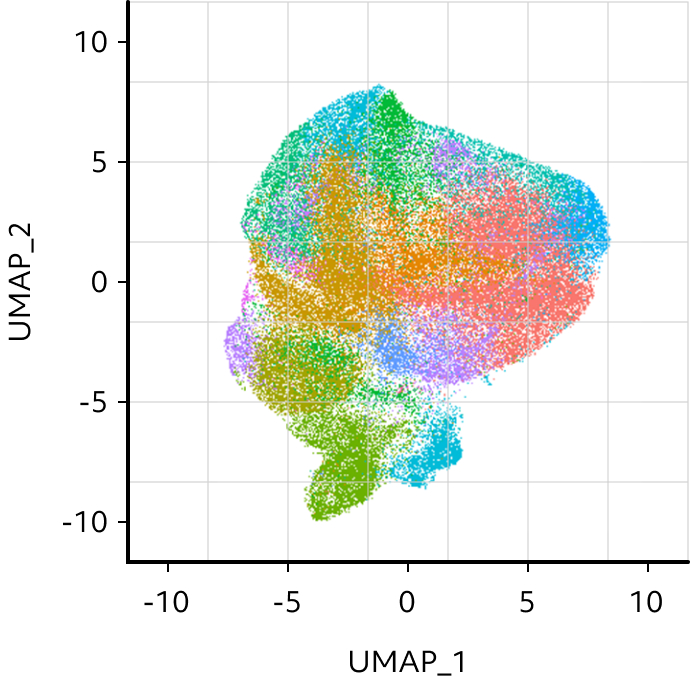
Sub types
Anti-Target
Cell types
Anti-Target
Sub types
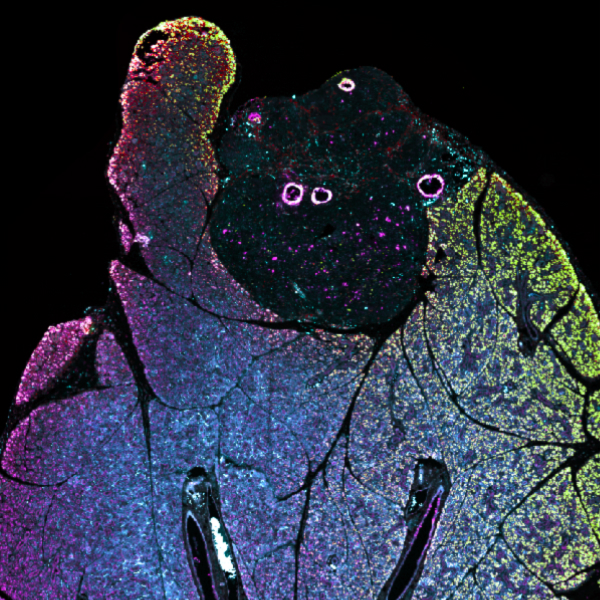
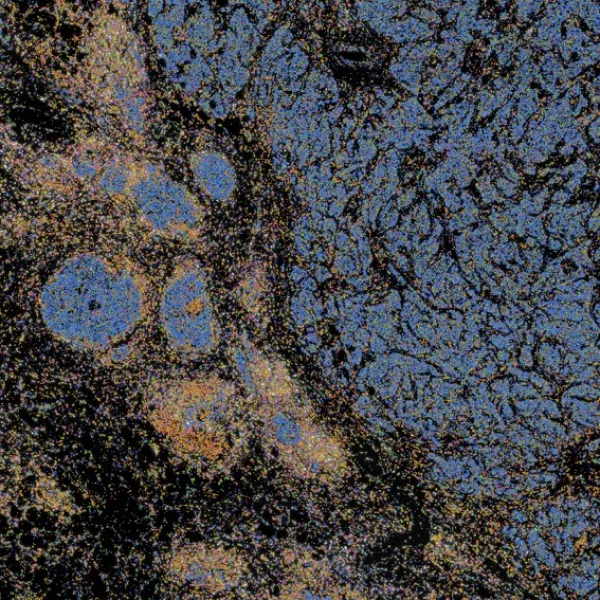
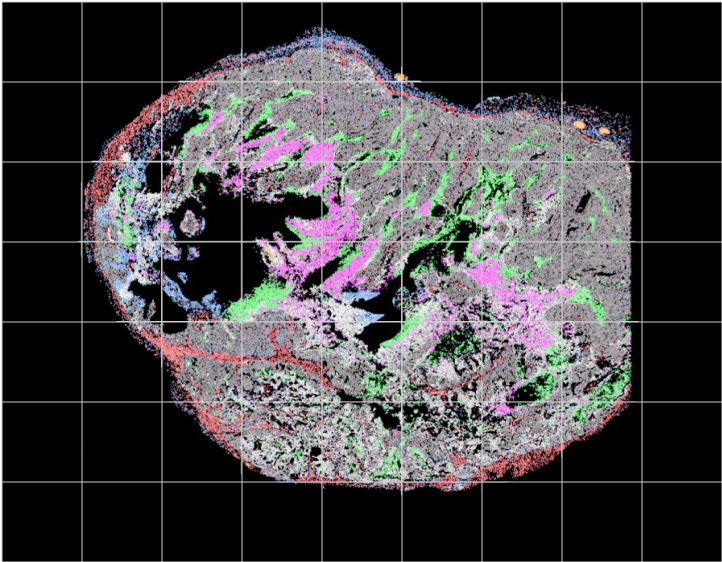
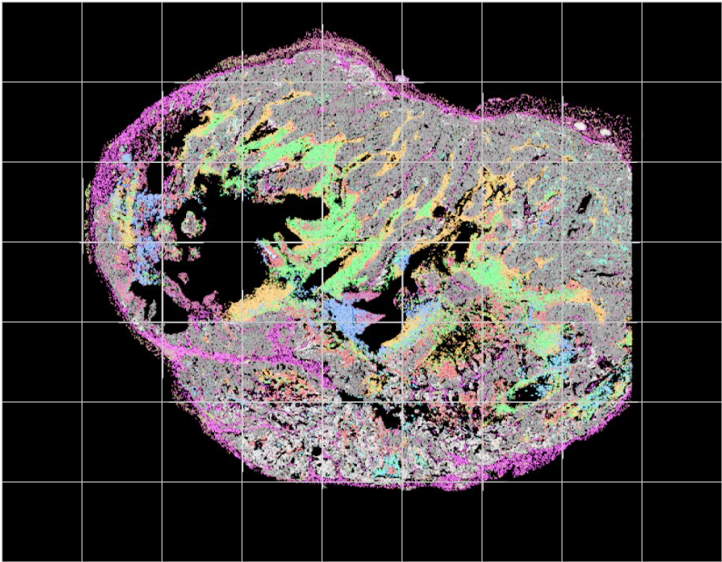
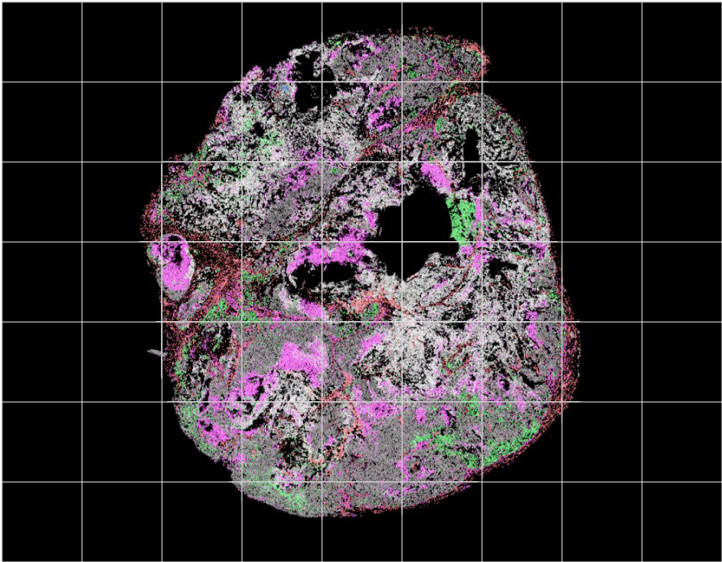
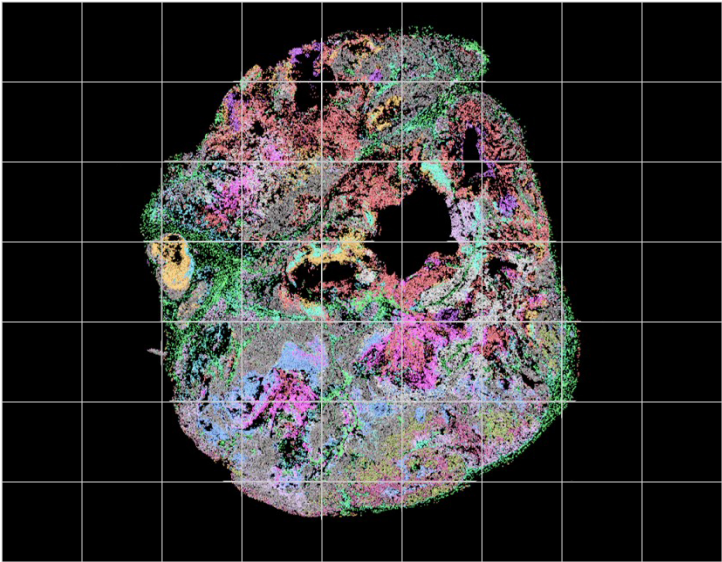
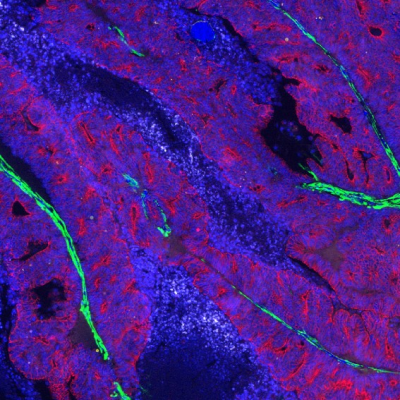
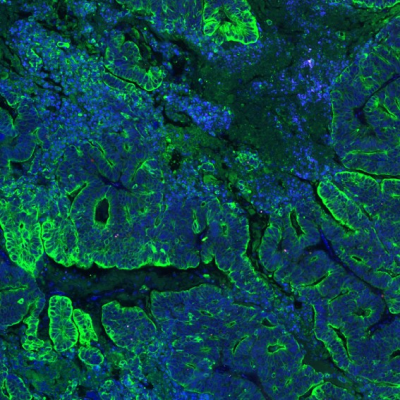
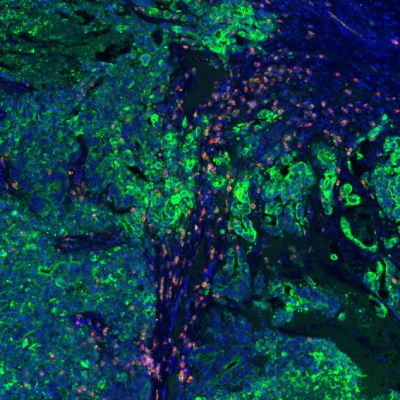
Identification of treatment mechanism through spatial analysis of cell types
IgG control
Cell types
IgG control
Sub types
Anti-BTLA
Cell types
Anti-BTLA
Sub types
IgG control
Cell types
Total = 236,688
IgG control
Sub types
CD44-, 21.9% HLA-A-, 14,4%
Total = 236,688
Anti-Target
Cell types
Total = 188,595
Anti-Target
Sub types
CD44-, 54.2% HLA-A-, 26,6%
Total = 188,595
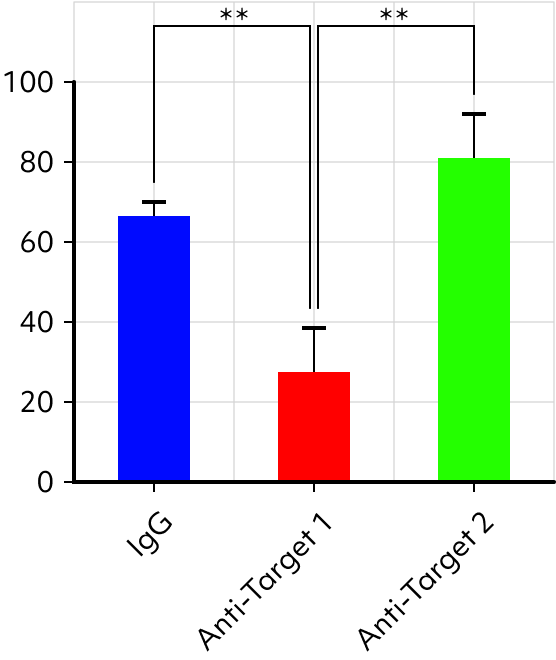
IgG
Anti-Target 1
Anti-Target 2
Target 2 = Binging partner for Target 1
% of positive cells
E-cadherin
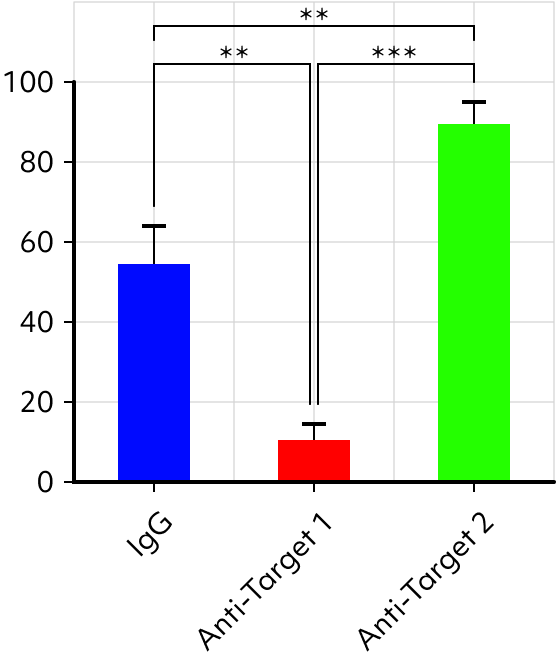
% of positive cells
CD44
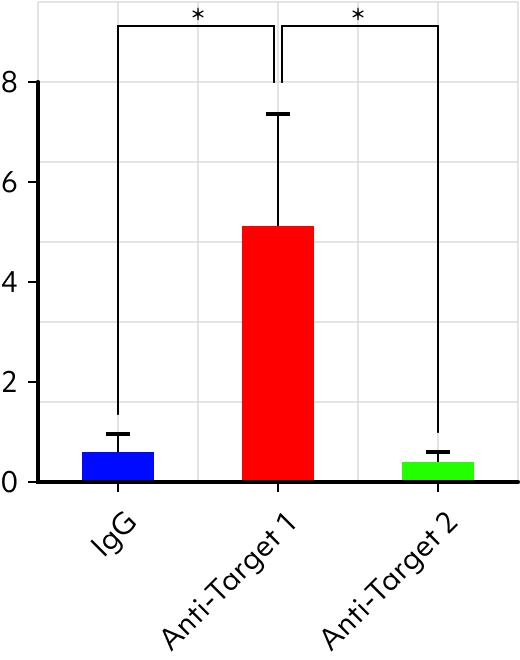
% of positive cells
CD8
Identifying immunological mechanisms underlying the efficacy of anticancer immunotherapy and discovering biomarker candidates through theapplication of spatial biology